Brent & WTI — Market drivers | H1 March 2026 (EN)

Brent and WTI were repriced by a clear, price-setting mechanism: Middle East transit risk turning into real logistics friction, with freight, insurance, and deliverability doing the heavy lifting, while inventory prints and surplus narratives only capped the move at the margin. Below is a disciplined driver map separating what truly set direction from what merely amplified volatility.
This post applies a systematic macro-energy framework used by professional oil market analysts to explain what actually moved prices — not what made headlines.
It focuses on physical fundamentals, financial and geopolitical effects, and crucially mechanisms, timing, and price impact.
🔴 MAJEURS — STRUCTURELS / DOMINANTS
Ce sont les forces qui fixent les prix. Si elles changent, le récit change.
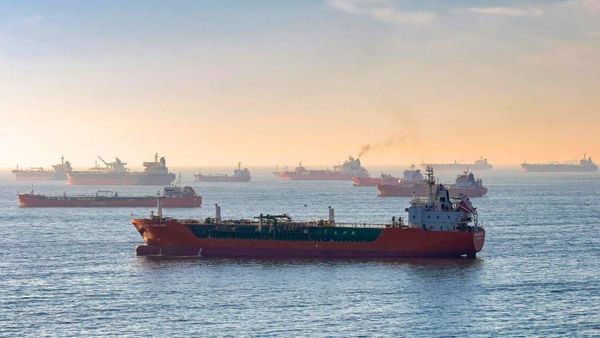
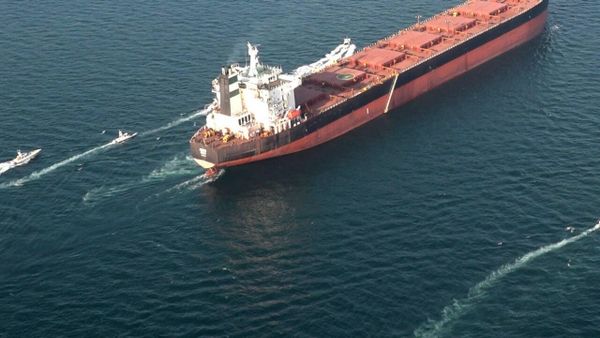
1) Strait of Hormuz disruption and war-risk shock to seaborne flows
- Category: Geopolitics | Logistics
- Mechanism: When tanker traffic through a chokepoint that handles a material share of global seaborne crude is disrupted, the market reprices the delivered availability of marginal barrels via higher risk premia, longer voyage times, and higher freight/insurance costs, lifting Brent and (via substitution) WTI.
- Region: Middle East chokepoint with global benchmark transmission
- Time horizon: Short-term
- Price impact: Bullish
- Character: Conjunctural
Key signal: >150 crude/LNG tankers anchored and navigation disruption reported; multiple tankers damaged and war-risk conditions intensified.
2) OPEC+ response function constrained by spare capacity concentration and policy timing
- Category: Supply
- Mechanism: A small, forward-dated quota increase does not offset an immediate logistics-driven supply impairment; with incremental capacity concentrated in a narrow set of producers, the market treats OPEC+ policy as a weak stabilizer versus a chokepoint shock.
- Region: OPEC+ (global supply setting)
- Time horizon: Short-term
- Price impact: Bullish
- Character: Structural
Key signal: OPEC+ agreed an April increase of 206 kb/d, while commentary emphasized limited spare capacity outside Saudi/UAE and the market’s focus on shipping disruption duration.
🟠 SIGNIFICATIFS — CONDITIONNELS / DE SOUTIEN
Ils influencent les prix à la marge ou temporairement, sans renverser le narratif dominant.
3) U.S. stocks and refinery run-rate signaled near-term slack
- Category: Stocks | Refining
- Mechanism: Large U.S. crude builds and lower refinery throughput weaken prompt physical tightness and cap rallies by raising onshore availability and reducing crude burn, but this signal was overridden by seaborne disruption risk concentrated outside the U.S.
- Region: U.S. (global marginal pricing via WTI and product flows)
- Time horizon: Short-term
- Price impact: Bearish
- Character: Temporary
Key signal: EIA reported U.S. commercial crude inventories +16.0 mb (to 435.8 mb) with refinery utilization ~88.6% and lower gasoline/distillate output in the week ending Feb 20.
4) 2026 surplus narrative limited conviction behind flat-price repricing
- Category: Supply | Demand
- Mechanism: Expectations of a global surplus and modest demand growth restrict the persistence of geopolitical rallies by framing them as premia rather than a balance shift, but the chokepoint shock dominated because it threatened immediate deliverability rather than end-year averages.
- Region: Global
- Time horizon: Medium-term
- Price impact: Bearish
- Character: Structural
Key signal: Reuters poll described a geopolitical risk premium alongside surplus estimates and tempered demand-growth assumptions.
5) Product-market softness in Asia (distillates) reduced crude pull at the margin
- Category: Product balances | Refining
- Mechanism: When middle/light distillate inventories rise and prompt structures lean weaker, refinery economics and run incentives soften, reducing incremental crude demand, but this failed to overpower the major drivers because the price-setting issue was crude deliverability and freight/war-risk costs.
- Region: Asia (regional signals with global product arbitrage linkage)
- Time horizon: Short-term
- Price impact: Bearish
- Character: Conjunctural
Key signal: Enterprise Singapore data showed light distillate stocks at record highs in the week to Feb 18.
🟡 SECONDARY DRIVERS — AMPLIFIERS / NOISE
These affect volatility, timing, or regional distortions, but rarely direction.
6) Short-covering and positioning concentration amplified day-to-day moves
- Category: Finance
- Mechanism: When headlines force rapid repricing, short-covering and concentrated positioning can accelerate intraday and 1–2 day swings without changing the underlying physical constraint, increasing volatility around the dominant narrative.
- Region: Global paper markets (ICE Brent, NYMEX WTI)
- Time horizon: Short-term
- Price impact: Neutral
- Character: Temporary
Key signal: Reuters explicitly flagged short-covering into geopolitics-driven sessions; CFTC concentration metrics show large shares of open interest held by top traders, consistent with squeeze dynamics.
7) Emergency stock-release signalling and “policy backstop” headlines
- Category: Stocks | Policy
- Mechanism: Public signalling around coordinated releases can dampen extremes by implying temporary supply substitution, but it rarely sets direction when the market is focused on transit risk, freight, and insurance availability.
- Region: OECD (SPR coordination) with global price transmission
- Time horizon: Short-term
- Price impact: Neutral
- Character: Conjunctural
Key signal: Reuters noted IEA monitoring and readiness to coordinate emergency SPR measures amid the shipping disruption narrative.
Bottom line:
The last 15 days were dominated by a geopolitics-to-logistics transmission: Hormuz disruption repriced deliverability and the cost of moving barrels, overwhelming balance-sheet signals like U.S. inventory builds.
OPEC+ policy was not a stabilizer because the increment was small, forward-dated, and constrained by the concentration of spare capacity, so the market focused on shipping status rather than quotas.
Rallies persisted when they were tied to evidence of impaired transit and higher war-risk/freight conditions, while sell-offs found support when “surplus” and inventory data capped how much of the move could be treated as a durable balance shift.
Sources: Reuters; U.S. EIA Weekly Petroleum Status Report; Enterprise Singapore; CFTC Commitments of Traders.
This analysis captures the visible drivers of oil prices. What it only touches on are the less observable dynamics: physical flow reallocations, Atlantic–Asia arbitrage shifts, freight-rate signals, crack-spread leading indicators, and conditional scenario analysis.
A deeper version of this analysis — including full scenario mapping and structural implications — is available in the "Deep-dive oil market analysis", designed for professionals who want to go beyond headlines. Sources: Reuters; Bloomberg; Financial Times; Wall Street Journal; U.S. EIA Weekly Petroleum Status Report; IEA Oil Market Report.