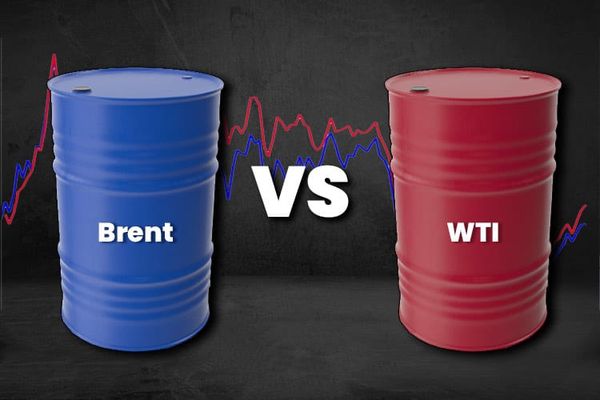
Brent & WTI — Market drivers | H1 February 2026 (EN)

Oil’s tape looked geopolitical, but the curve stayed disciplined by balance expectations and physical pricing signals. Here’s what truly set prices—and what didn’t.
This post applies a systematic macro-energy framework used by professional oil market analysts to explain what actually moved prices — not what made headlines.
It focuses on physical fundamentals, financial and geopolitical effects, and crucially mechanisms, timing, and price impact.
🔴 MAJOR DRIVERS — STRUCTURAL / DOMINANT
These are price-setting forces. If they change, the narrative changes.
1) Surplus narrative re-anchors the curve via OSP pressure and Asia prompt weakness
Category: Supply | Demand
- Mechanism: Expectations of a material Q1 2026 surplus re-price the front-end by weakening prompt pricing power (Dubai structure turning more contango-like and Middle East official selling prices moving down), which caps benchmark upside unless a shock removes barrels for long enough to force visible inventory draws.
- Region: Global (signal originates in Asia/Middle East pricing)
- Time horizon: Medium-term
- Price impact: Bearish
- Character: Structural
Key signal: Saudi March OSP indications (Arab Light towards a discount vs Oman/Dubai) alongside IEA-referenced surplus estimates and consensus surplus ranges.
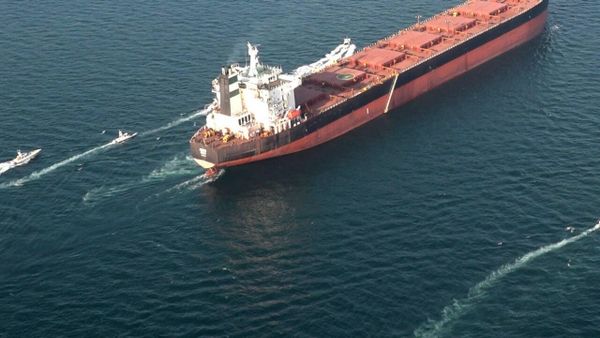
2) Iran risk premium concentrated on Strait of Hormuz tail-risk
- Category: Geopolitics
- Mechanism: The market repriced short-dated barrels via a geopolitical convexity premium as the probability-weighted cost of a Gulf export disruption rose, mechanically lifting prompt Brent more than back months and keeping WTI supported through global linkage. The key channel is not “newsflow” but the embedded option value of secure seaborne Middle East supply when the marginal barrel is waterborne.
- Region: Middle East → global seaborne crude (Brent-led)
- Time horizon: Short-term
- Price impact: Bullish
- Character: Conjunctural
Key signal: Implied oil volatility spiked above 50 while prices accelerated to ~5-month highs on explicit Hormuz disruption framing.
3) Cluster of supply outages tightening prompt balances, without changing the surplus narrative
- Category: Supply | Logistics | Stocks
- Mechanism: A burst of unplanned supply interruptions compressed nearby availability and improved prompt sentiment: U.S. weather-driven production losses and export interruptions tightened WTI-linked flows, while Kazakhstan CPC/Tengiz disruptions reduced Black Sea-linked exports; in parallel, U.S. crude inventories printed a draw versus expectations, reinforcing a near-term tightening impulse. This lifted front-end pricing while leaving the medium-horizon ceiling intact because baseline 2026 supply growth and expected surplus remained the anchor.
- Region: U.S. (WTI) + Kazakhstan/Black Sea (Brent-linked differentials)
- Time horizon: Short-term
- Price impact: Bullish
- Character: Temporary
Key signal: U.S. production outages peaked near ~2 mbpd with Gulf Coast exports briefly at zero; CPC/Tengiz disruptions implied >40 mbbl export losses; EIA showed a 2.3 mbbl crude draw to ~423.8 mbbl (below 5-yr avg) for week ending Jan 23.
🟠 SIGNIFICANT DRIVERS — CONDITIONAL / SUPPORTIVE
These influence prices at the margin or temporarily, but do not override the dominant narrative.
4) China as the balancing sink for surplus barrels (storage absorption, price-sensitive)
- Category: Demand | Stocks
- Mechanism: China’s “surplus into storage” function damped downside by absorbing incremental seaborne supply, effectively acting as a buffer that slows inventory builds elsewhere when prices are attractive. This remains supportive rather than dominant because it stabilizes the glut rather than removing it, and it does not neutralize supply shocks if they hit export infrastructure.
- Region: China/import market (Brent-linked)
- Time horizon: Short-term
- Price impact: Bullish
- Character: Conjunctural
Key signal: Reuters-calculated China crude surplus rose sharply (Dec surplus cited at ~2.67 mbpd; 2025 surplus ~1.13 mbpd), consistent with storage pull on global overhang.
5) OPEC+ policy “pause” and spare capacity as a cap on sustained upside impulse
- Category: Supply | Policy
- Mechanism: With OPEC+ halting further production hikes into early 2026, the group reduced the probability of policy-driven oversupply acceleration, which supported the front end during outage-driven tightening. It fails to overpower the major drivers because it is a stabilizer, not a catalyst: it limits downside volatility but does not remove the market’s base-case surplus expectations.
- Region: OPEC+ (global)
- Time horizon: Medium-term
- Price impact: Neutral
- Character: Structural
Key signal: Vitol flagged Kazakhstan losses as reducing expected H1 2026 stock builds (still positive), while the IEA surplus framing remained large for Q1 2026.
6) Macro/FX cross-currents: weaker USD and rates “on hold” offsetting episodic risk-off
- Category: Macro | Finance
- Mechanism: USD weakness mechanically eased the affordability constraint for non-USD buyers, while “rates on hold” language reduced immediate tightening pressure on risk assets, both supporting crude at the margin. This stayed secondary because the price-setting move came from geopolitical convexity and physical outages; macro mainly modulated the magnitude and timing rather than setting direction.
- Region: Global
- Time horizon: Short-term
- Price impact: Bullish
- Character: Conjunctural
Key signal: Reuters linked the late-window oil push to a weaker dollar, while separate risk-off volatility impulses were triggered by tariff threats.
🟠 SIGNIFICANT DRIVERS — CONDITIONAL / SUPPORTIVE
These influence prices at the margin or temporarily, but do not override the dominant narrative.
7) Financial positioning not “doing the work” (limits on momentum extension)
- Category: Finance
- Mechanism: CFTC data show managed money length was not the primary marginal buyer into the move: in WTI, managed money net length was broadly stable week-on-week, and in Brent it fell even as prices rose, consistent with a rally led by physical/geopolitical repricing rather than a leverage chase. This amplifies intraday volatility but rarely sustains direction without a physical catalyst.
- Region: NYMEX/ICE-linked paper markets
- Time horizon: Short-term
- Price impact: Neutral
- Character: Temporary
Key signal: WTI managed money ~169,655 long vs ~122,155 short (Jan 20) with small week-on-week changes; Brent managed money longs fell ~3,173 w/w (Jan 20).
8) Front-curve structure/volatility as transmission channels (not root causes)
- Category: Finance | Market structure
- Mechanism: Volatility spikes and prompt-structure sensitivity transmitted the shock into time spreads and headline settlements, accelerating moves when liquidity thinned. These are secondary because they respond to (and magnify) the dominant inputs—geopolitical tail-risk and near-term physical tightness—rather than creating them.
- Region: Brent & WTI curves
- Time horizon: Short-term
- Price impact: Neutral
- Character: Temporary
Key signal: Oil volatility (OVX) moved sharply higher during the Iran-led repricing window.
Bottom line:
The dominant structure over the last 15 days was a market anchored by surplus expectations and weakening physical pricing signals, repeatedly overlaid by an Iran-driven geopolitical premium that set the daily tape.
Rallies persisted when escalation risk and short-lived supply interruptions tightened prompt sentiment, but they failed to re-rate the curve because OSP/structure and balance estimates kept reinforcing “plenty of oil” outside shock scenarios.
A narrative shift requires sustained, observable supply loss through major export routes and/or coordinated producer action large enough to neutralize the projected Q1 surplus, not just brief outages or headlines.
This analysis captures the visible drivers of oil prices. What it only touches on are the less observable dynamics: physical flow reallocations, Atlantic–Asia arbitrage shifts, freight-rate signals, crack-spread leading indicators, and conditional scenario analysis.
A deeper version of this analysis — including full scenario mapping and structural implications — is available in the "Deep-dive oil market analysis", designed for professionals who want to go beyond headlines. Sources: Reuters; Bloomberg; Financial Times; Wall Street Journal; U.S. EIA Weekly Petroleum Status Report; IEA Oil Market Report.
Sources: Reuters; Bloomberg; Financial Times; Wall Street Journal; U.S. EIA Weekly Petroleum Status Report; IEA Oil Market Report.